
The concept of safety and security have been prevalent from the early days of human existence. Back in the day, watch towers and sentries were a way for kings to keep a watch on their surroundings.
In the modern day setup, information security is a bigger challenge than physical security. Confidential & sensitive data runs into petabytes and it becomes all the more important to safeguard not only the data but the entire infrastructure.
Businesses today employ an array of security solutions to safeguard their infrastructure. A common and vital element of any security strategy/tool is logging.
Logs are digital, text based records of all the activities that happen in an organization. These provide you with an audit trail that you can use to monitor various activities within your organization, identify policy violations and any unusual activity.
Logs can be generated by various systems in your environment - applications, firewalls, network devices and the likes. These are a great way to know what is happening/happened, who did it, when did it happen, where did it happen. These details play a critical role during compliance audits.
In this post we'll focus on how logging and Audit logs work in Paralus.
Audit Logs in Paralus
All the API actions that are performed by any user using Paralus are recorded as part of the audit logs in Paralus. These provide a sequential log of activities that - an audit trail- that acts as evidence during compliance checks and other investigations.
These logs are generated by actions performed by any authorized user across the organization. Further, only authorized users are provided access to view the logs, but none of it could be deleted.
Paralus allows you to track two types of logs:
- System Logs
- Kubectl Logs
- Command
- API Logs
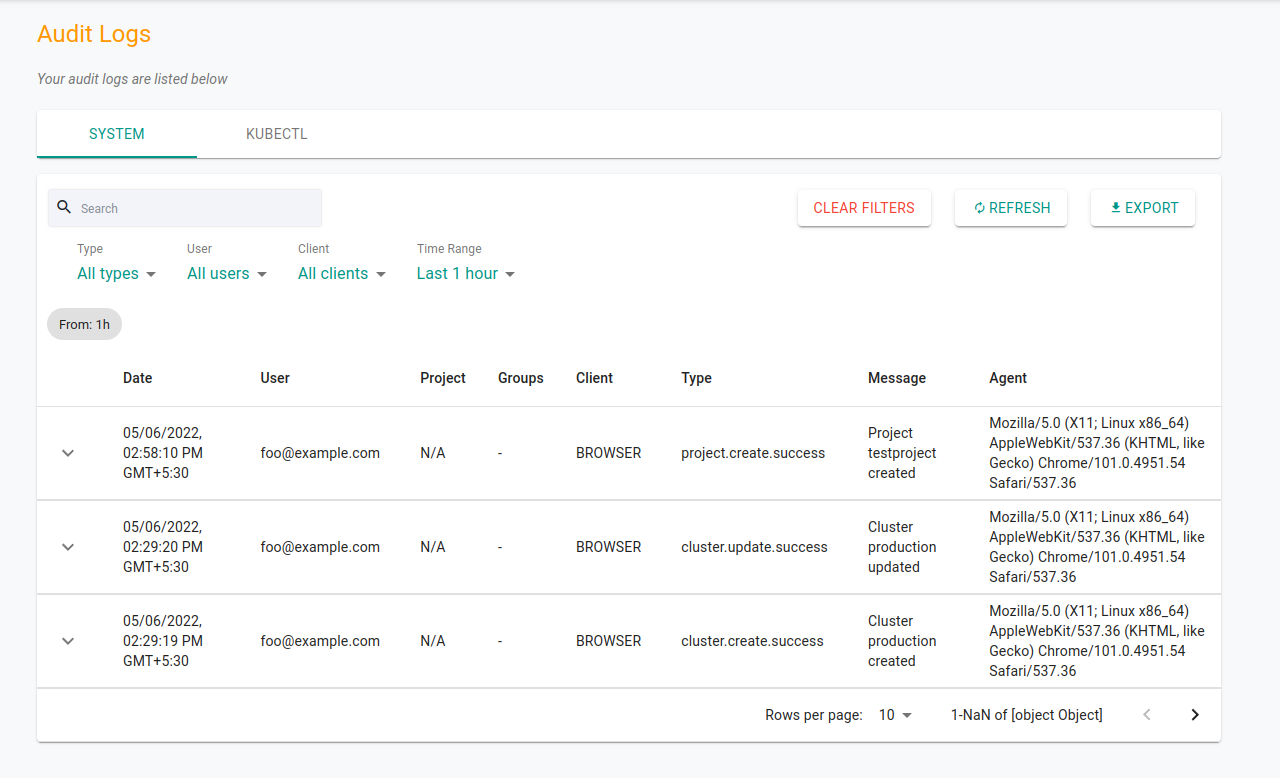
System Logs: These types of logs contain the entire history of activities performed in a specific organization. Activities like adding a user, creating a project, generating a new kubeconfig etc. are recorded. These include actions performed via the dashboard and pctl.
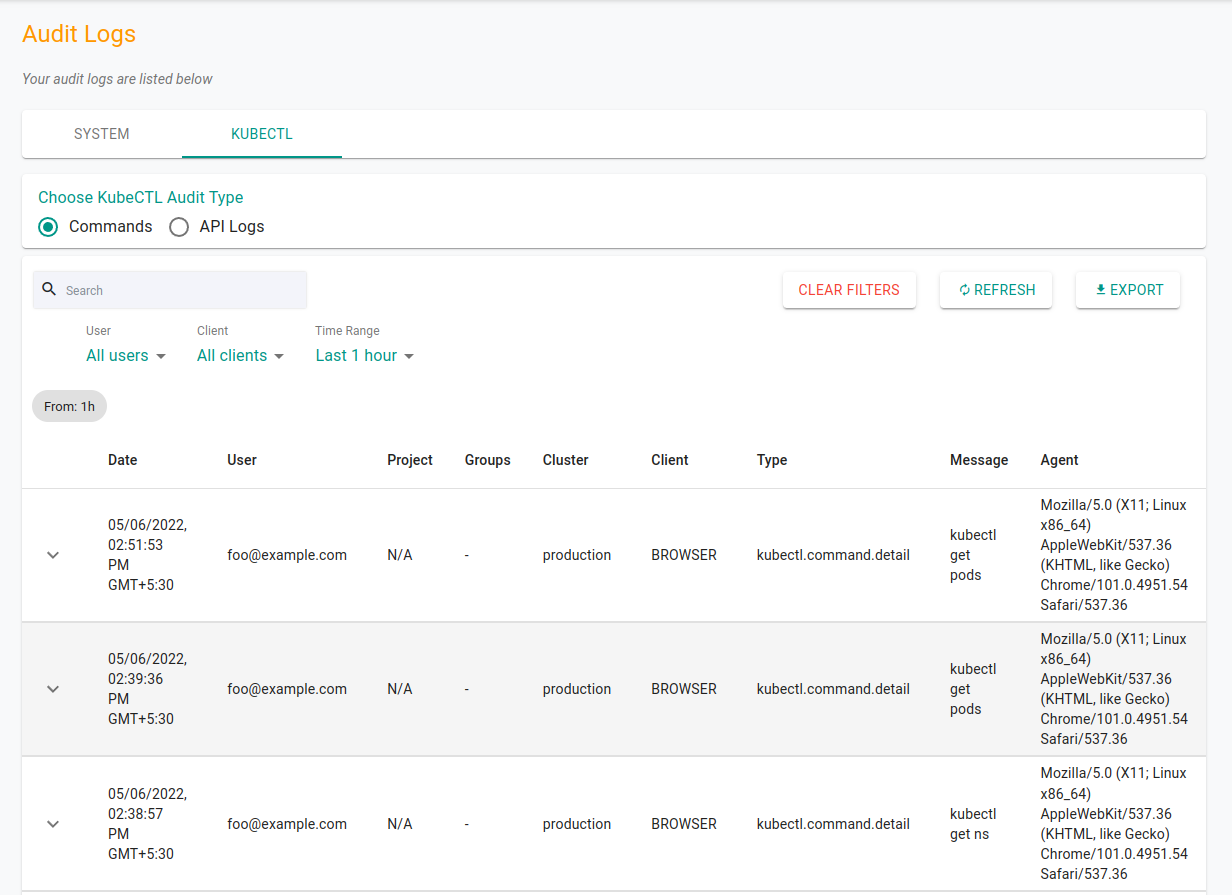
Kubectl Logs: When it comes to kubectl and Kubernetes commands, Paralus records them in two different sections:
Command Logs: All the kubectl commands executed by an authorized user from the prompt via the dashboard are recorded under command logs.
API Logs: All the Kubernetes API calls made from prompt, local terminal or by any other means are recorded under the API logs.
For both these types of logs, Paralus logs quite a few details that will help you identify and audit trails.
Read more about Audit logs.
How To Use Audit Logs In Paralus
Every action performed by a user on any resource is logged by Paralus. You can use these logs along with an audit trail and ensure compliance and block malicious activities. Below are a few use cases where you can use Paralus's audit log capabilities
Auditing request IP addresses for compromised credentials
One of the good things about audit logs is that it provides you with an audit trail of all the activities that have taken place during a specific period. In Paralus too, the audit logs provide you with details like IP address, host, action, command executed along with other helpful details. In an event when you notice suspicious activity within your Kubernetes infrastructure, you can use these audit logs to help you with an audit trail.
Audit trails can help your identify if one of your authorized users has been accessing your cluster resources but from different IP addresses that aren't from your network. You know something isn't right. Carefully examining the request IP addresses in the audit logs, you’ll be able to figure out the compromised credentials. After you have identified the user, you can immediately revoke their access and launch an investigation to find the exact root cause.
Inspecting Logs From Multiple Clusters
A core feature that Paralus offers out of the box is the ability to import and manage multiple clusters. These clusters can reside on your on-prem or be managed by a cloud service provider. Paralus allows you to manage them from a single dashboard.
What that also does is that it allows you to view the activities that are happening across different clusters. The audit logs feature in Paralus lists down all the activities along with the project, cluster and the action performed. It allows an organization admin to inspect all the audit trails generated for every cluster irrespective of where they are.
Conclusion
Logging as we discussed earlier is one of the simplest forms to monitor activities in your system. When it comes to Kubernetes, it also provides logging for applications, Kubernetes clusters and audit logs. Paralus takes it up a notch and allows you to view and manage activity logs from multiple clusters. Audit logs in Paralus provides you with audit trails from across all the clusters in a single dashboard. These logs are effective and help you monitor activities across your Kubernetes infrastructure. Refer to our Audit Logs guide to know more.
In case you need any further inputs, feel free to join our Slack channel or connect with us on Twitter.
